Powerful Data-Driven Results
What is Blistering Data?
For organisations that rely on a physical presence to reach their target customers, knowing where the best locations are, is either difficult, relies on guess-work, or is very expensive.
Blistering Data can help Marketers and Agencies identify the most fruitful suburbs to focus their marketing efforts on, at significantly better value than typical data companies.
Why trust our Data?
A client came to me saying he'd been quoted on some data, and asked me if there was a way to do it cheaper. I said absolutely, and delivered what he wanted for less than a fifth of the cost.
He was already deeply knowledgeable about his industry, and our results gave him the gut-check he needed to spend his marketing budget with full confidence.
On top of identifying the suburbs he already expected, our algorithm ranked-highly several suburbs he did not, which he added to his campaign strategy.
He was outstandingly pleased with the results.
What sort of data are we talking?
Anything from the ABS, plus whatever else we could find so far: ethnicity, languages spoken, illnesses, long-term illness, hospital admissions, low-income/high-income areas, mortgaged vs rented rates, housing-fullness, faiths, and of course age and sex data.
There's way too much data to list on this page, these are just some examples. The actual list of categories is extensive, currently over 3700, so talk to us about what you specifically need and if we don't already have it, we will do our best to find it.
The real problem everyone is facing these days is not the lack of data, but a way of making sense of it all. We built a solution to solve this problem for my client, and we can use it to solve the same problem for you. All you'll need to give us are the features your person-of-interest has, and we'll show you which suburbs you're most likely to bump into people with those features on the street. The data is Australia-wide, but can be narrowed down to any particular areas of interest.
What will I actually be getting?
Once we've built the indicators, you'll have a chance to look through the list of categories we've identified and provide some feedback. If all looks good, we'll run it through the rest of our proprietary software, and generate excel files which look like this:
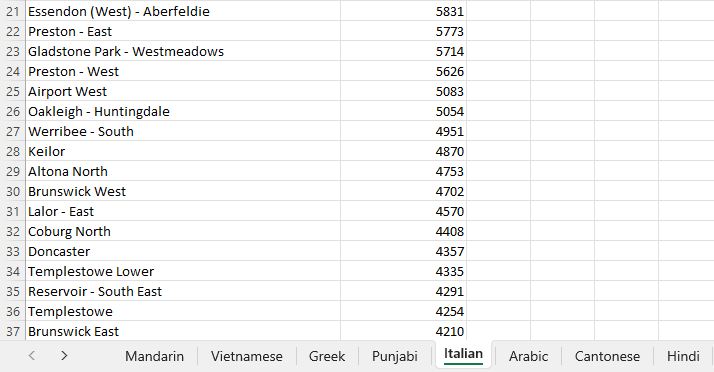
This image is the result for a client who was interested in knowing how various languages were distributed throughout Victoria. They wanted the top 20 languages spoken in VIC and a suburb ranking for each, and then wanted this data crossed against a persona (indicator) we had investigated previously. This segmented their target customer by language spoken. They already had good support for certain languages, and were looking for gaps where they felt they had fewer customers than they potentially should. That allowed them to target ads to those specific under-served ethnicities in the best neighbourhoods they were likely to be found. This client was also thrilled by their results.
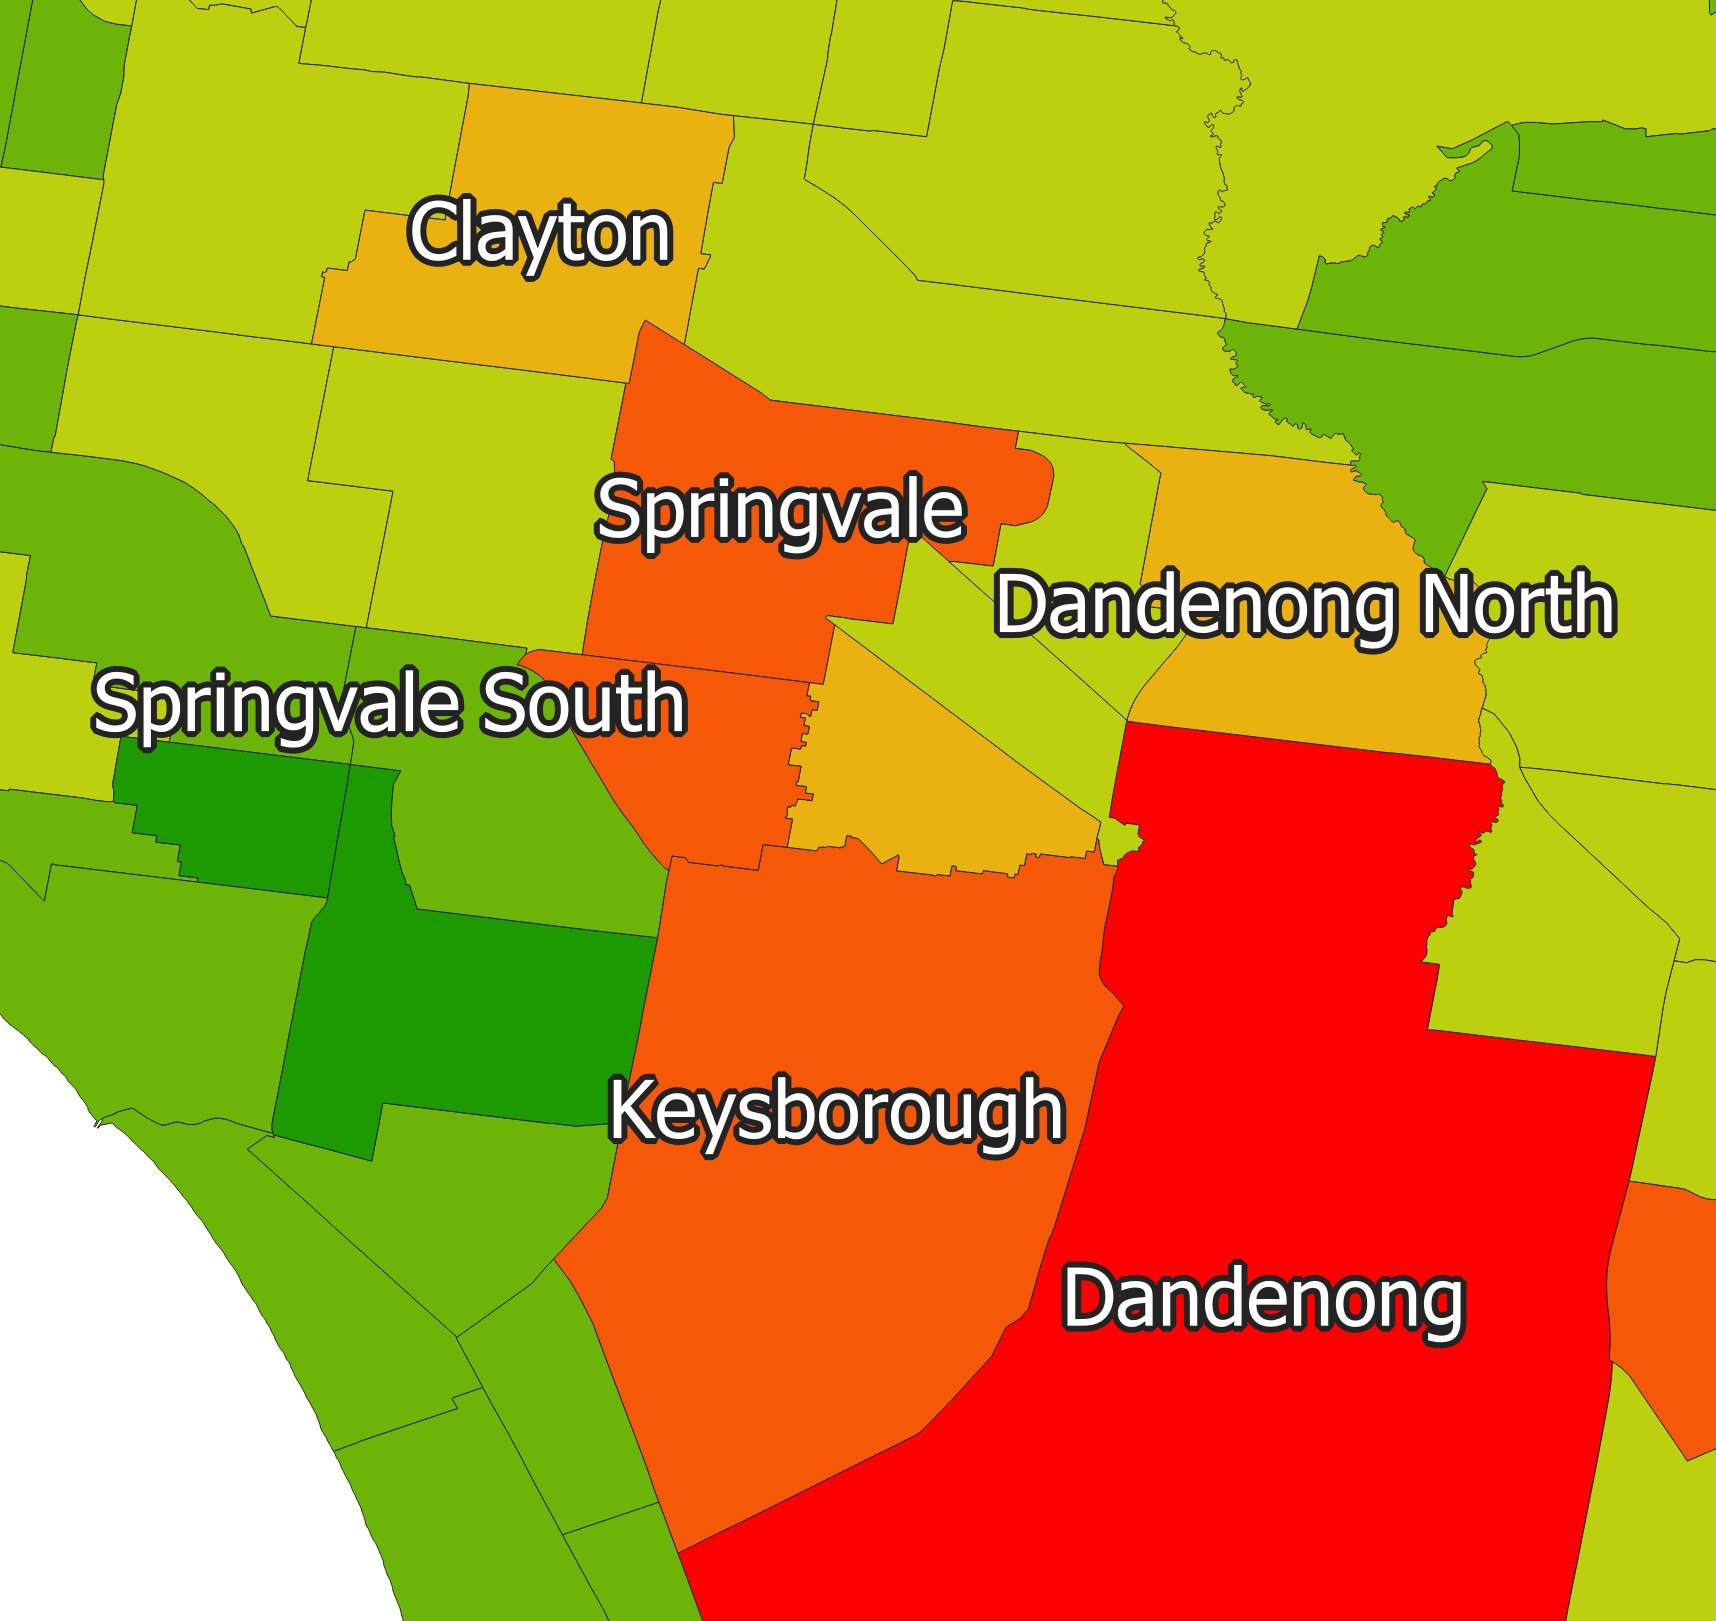
We can also generate maps based on the data to help identify any visual patterns that might exist in the data. The following map was delivered to a client looking for a visual map of their persons of interest. The areas are coded from green (least likely) to red (most likely), to bump into someone on the street who had the features they were looking for. Sometimes you just need a list, sometimes you need to see the bigger picture.